Your Perfect Research Guide
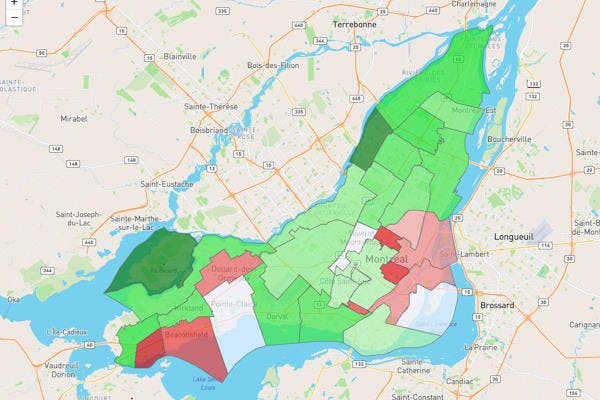
You will find that the stats page from Appartogo will be useful in your search for your dream apartment as it visually shows you directly on the map how your neighbourhoods of interest compare themselves with all the others on the Island of Montreal.
The Appartogo Stats
Let us analyze each element in the page in order to make you aware of the important elements.

1. At the time of our screenshot, 1543$/month is the average rental price of all apartments on the Island of Montreal in our database at the time where the stats page was displayed.
2. Our statistics are updated many times each day. You can see here the date and time of the last update and the total number of apartments at that time in our database.

3. When you click on a specific neighbourhood on the map you will see the stats appear for that neighbourhood. In this example, for Anjou, the average rental price was 1138$/month, which is 401$/month less than the average of 1539$/month. So, 26% less expensive than, on average, the other neighbourhood on the Island of Montreal.
Legend
The legend here indicates, visually, how to quickly identify which neighbourhoods represent the best deals, in dark green, and are neighbourhoods that are, on the contrary, more expensive that the Island average, from slightly more expensive in light red to a lot more expensive in dark red.

Comparison table
Lastly, the comparison table at the bottom of the page, will allow you to compare more accurately, per neighbourhood, the average rental cost with respect to the average for the entire Island of Montreal.

4. It is important to note that the average price of apartments in one neighborhood is calculated from all apartments in that neighbourhood only. In this example, there was only 6 apartments to rent in Beaconsfield at the time where the stats page was called and displayed. And so, the average price was only based, in that case, on those 6 apartments. So you need to be careful while interpreting the stats and always make sure that the number of apartments in our calculation is sufficiently high for the average number to have value.
5. The higher the number of apartments is for a given neighbourhood the more the average price will match the market price in the field. In Côte-des-Neiges-Notre-Dame-de-Grâce for instance the number of apartments to rent was fairly high at 1672 and so the gap between the average price for that neighbourhood and the average for the entire Island of Montreal will be much more accurate.
6. In this case the average price for rent is 100$ less than the rest of the Island of Montreal.
7. Or 7% less expensive than the rest of the Island of Montreal
Other Source of Information
Other sources of information exist on the Internet, like the Rental Market Data from the Canada Mortgage and Housing Corporation (CMHC) that will complement and help you in your research. But what distinguishes our data from the CMHC is that they truly reflect the apartment rental market at the time were the stats page was called and displayed. Our data are directly linked with the current, live market.
Happy searching!